
By Mati Ullah Khan
Pakistan has been governed by all mainstream political parties since last one-and-half decade; however, it could never overpower the shackles of economic instability and in fact the Country now remains on the verge of default.
It would be unfair to pin a blame of the dismal state of economic affairs on a particular political party; hence, it’s been years of incompetence and directionless approach, pushing the Country to become heavily dependent on foreign assistance and an import-led economy.
In such scenario, Pakistan remains extremely vulnerable to the global situation. The below-given Fiscal Year (FY) financial statistics also implies that whenever the world witnessed an economic slowdown caused by 2008 global recession, COVID-19 or Russia-Ukraine conflict, Pakistan’s economy went into turmoil.
Yet the internal mismanagement, incompetence, financial malpractices, political instability, and natural disasters like floods have also been responsible to intensify Pakistan’s economic woes over the years.
 Political Parties’ tenures:
Pakistan People’s Party (PPP): From March 25, 2008 to March 24, 2013
Pakistan Muslim League-Nawaz (PML-N): From June 05, 2013 to May 31, 2018
Pakistan Tehreek-e-Insaf (PTI): From August 18, 2018 to April 04, 2022:
Pakistan Democratic Movement (PDM): From April 11, 2022 to date
Growth: GDP, Industrial, Agriculture & Services Sector:
Ruling Party |
Fiscal Year |
GDP Growth* |
Industrial Growth** |
Agriculture Growth** |
Services Sector Growth** |
|
Base Year: 2005-06 = 100 |
|||||
|
PPP |
2008-09 | 0.4% | -5.21% | 3.50% | 1.33% |
| 2009-10 | 2.6% | 3.42% | 0.23% | 3.21% | |
| 2010-11 | 3.6% | 4.51% | 1.96% | 3.94% | |
| 2011-12 | 3.8% | 2.55% | 3.62% | 4.40% | |
| 2012-13 | 3.7% | 0.75% | 2.68% | 5.13% | |
|
PML-N |
2013-14 | 4.1% | 4.53% | 2.50% | 4.46% |
| 2014-15 | 4.1% | 5.18% | 2.13% | 4.36% | |
| 2015-16 | 4.6% | 5.69% | 0.15% | 5.72% | |
|
Base Year: 2015-16 = 100 |
|||||
| 2016-17 | 4.61% | 4.61% | 2.22% | 5.62% | |
| 2017-18 | 6.10% | 9.18% | 3.88% | 5.95% | |
|
PTI |
2018-19 | 3.12% | 0.25% | 0.94% | 5.0% |
| 2019-20 | -0.94% | -5.75% | 3.91% | -1.21% | |
| 2020-21 | 5.77% | 7.81% | 3.48% | 6.0% | |
| 2021-22 | 6.10% | 6.83% | 4.27% | 6.59% | |
| PDM*** | 2022-23 | -0.17% | -3.76% | 2.25% | 0.07% |
*https://www.pbs.gov.pk/sites/default/files/tables/national_accounts/2021-22/Table_6.pdf
**https://www.finance.gov.pk/supplement_2021_22.pdf
**https://www.finance.gov.pk/Supplement_2020_21.pdf
***https://www.pbs.gov.pk/sites/default/files/press_releases/2023/Press%20release%20for%20107th%20NAC%20Meeting%20Final.pdf
Revised GDP for FY 2021-22 -(https://www.finance.gov.pk/survey/chapters_23/01_Growth_and_Investment.pdf)
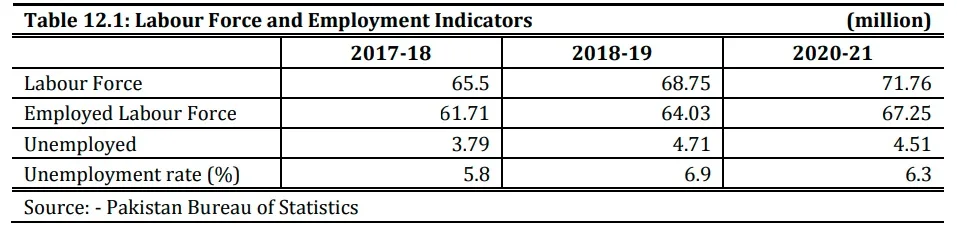
Employment:
Ruling Party |
Fiscal Year |
Employed Labor Force* |
Unemployed |
|
|
PPP |
2008-09 | 52.86 million | 1.4 million jobs annually | 3.05 million |
| 2009-10 | 53.76 million | 3.16 million | ||
| 2010-11 | 54.40 million | 3.44 million | ||
| 2011-12 | 55.80 million | 3.53 million | ||
| 2012-13 | 56.58 million | 3.76 million | ||
|
PML-N |
2013-14 | 56.52 million | 1.14 million jobs annually | 3.58 million |
| 2014-15 | 57.42 million | 3.62 million | ||
| 2015-16 | – | – | ||
| 2016-17 | – | – | ||
| 2017-18 | 61.71 million | 3.79 million | ||
|
PTI |
2018-19 | 64.03 million | 1.84 million jobs annually | 4.71 million |
| 2019-20 | – | – | ||
| 2020-21 | 67.25 million | 4.51 million | ||
Note: The Labour Force Survey was not conducted in the years 2011-12, 2015-16 and 2016-17.
*https://www.finance.gov.pk/survey/chapter_22/PES12-POPULATION.pdf
Inflation & Fiscal Deficit:
Ruling Party |
Fiscal Year |
CPI Inflation* |
Fiscal Deficit(% of GDP) *** |
|
Base Year: 2005-06 = 100 |
|||
|
PPP |
2008-09 | 17.0% | 5.2 |
| 2009-10 | 10.1% | 6.2 | |
| 2010-11 | 13.6% | 6.5 | |
| 2011-12 | 11.0% | 8.8 | |
| 2012-13 | 7.3% | 8.2 | |
|
PML-N |
2013-14 | 8.6% | 5.5 |
| 2014-15 | 4.5% | 5.3 | |
| 2015-16 | 2.8% | 4.1 | |
|
Base Year: 2015-16 = 100 |
|||
| 2016-17 | 4.8% | 5.2 | |
| 2017-18 | 4.6% | 5.8 | |
|
PTI |
2018-19 | 6.8% | 7.9 |
| 2019-20 | 10.7% | 7.1 | |
| 2020-21 | 8.9% | 6.1 | |
| 2021-22 | 12.2% | 7.9 | |
|
PDM |
2022-23 | 29.2%** | 3.6 (July-March) |
* https://www.finance.gov.pk/supplement_2021_22.pdf
**https://finance.gov.pk/economic/economic_update_July_2023.pdf
***https://www.finance.gov.pk/survey/chapters_21/04-Fiscal.pdf
Also Read: Inflation in PML-N governments
Also Read: Inflation in PPP governments
Tax Collection, Expenditures & Revenues:
Ruling Party |
Fiscal Year |
Net Tax Collection* |
Total Expenditures |
Total Revenues |
|
PPP |
2008-09 | Rs 1,161.2 billion | Rs 2,531 billion | Rs 1,850 billion |
| 2009-10 | Rs 1,327.4 billion | Rs 3,007 billion | Rs 2,078 billion | |
| 2010-11 | Rs 1,558.0 billion | Rs 3,447 billion | Rs 2,252 billion | |
| 2011-12 | Rs 1,882.7 billion | Rs 4,327 billion | Rs 2,566 billion | |
| 2012-13 | Rs 1,946.4 billion | Rs 4,816 billion | Rs 2,982 billion | |
|
PML-N |
2013-14 | Rs 2,254.5 billion | Rs 5,026 billion | Rs 3,637 billion |
| 2014-15 | Rs 2,590.0 billion | Rs 5,387 billion | Rs 4,446 billion | |
| 2015-16 | Rs 3,112.5 billion | Rs 5,796 billion | Rs 4,446 billion | |
| 2016-17 | Rs 3,367.9 billion | Rs 6,800 billion | Rs 4,936 billion | |
| 2017-18 | Rs 3,843.8 billion | Rs 7,488 billion | Rs 5,228 billion | |
|
PTI |
2018-19 | Rs 3,828.5 billion | Rs 8,345 billion | Rs 4,900 billion |
| 2019-20 | Rs 3,997.4 billion | Rs 9,648 billion | Rs 6,272 billion | |
| 2020-21 | Rs 4,745.0 billion | Rs 10,306 billion | Rs 6,903 billion | |
| 2021-22 | Rs 6,148.5 billion | Rs 13,295 billion | Rs 8,035 billion | |
|
PDM |
2022-23 | Rs 7,169 billion ** | Rs 10,016 billion (July-March) | Rs 6,938 billion) (July-March) |
* https://www.fbr.gov.pk/revenue-collections/142253/131355
**https://www.finance.gov.pk/economic/economic_update_May_2023.pdf
Exports, Imports, Trade Deficit & CAD:
Ruling Party |
Fiscal Year |
Exports* |
Imports* |
Trade Deficit* |
Current Account Deficit (CAD)*** |
|
PPP |
2008-09 | US$ 19.1 billion | US$ 31.7 billion | US$ 17.1 billion | US$ 9.2 billion |
| 2009-10 | US$ 19.7 billion | US$ 31.1 billion | US$ 15.4 billion | US$ 3.9 billion | |
| 2010-11 | US$ 25.4 billion | US$ 35.8 billion | US$ 15.6 billion | US$ 214 million (Surplus) | |
| 2011-12 | US$ 24.7 billion | US$ 40.4 billion | US$ 21.2 billion | US$ 4.6 billion | |
| 2012-13 | US$ 24.8 billion | US$ 40.2 billion | US$ 20.4 billion | US$ 2.5 billion | |
|
PML-N |
2013-14 | US$ 25.1 billion | US$ 41.7 billion | US$ 19.9 billion | US$ 3.1 billion |
| 2014-15 | US$ 24.1 billion | US$ 41.4 billion | US$ 22.1 billion | US$ 2.8 billion | |
| 2015-16 | US$ 21.9 billion | US$ 41.1 billion | US$ 23.8 billion | US$ 4.9 billion | |
| 2016-17 | US$ 22 billion | US$ 48 billion | US$ 32.4 billion | US$ 12.2 billion | |
| 2017-18 | US$ 24.8 billion | US$ 55.7 billion | US$ 37.5 billion | US$ 19.1 billion | |
|
PTI |
2018-19 | US$ 24.3 billion | US$ 51.9 billion | US$ 31.8 billion | US$ 13.4 billion |
| 2019-20 | US$ 22.5 billion | US$ 43.6 billion | US$ 23.1 billion | US$ 4.4 billion | |
| 2020-21 | US$ 25.6 billion | US$ 54.3 billion | US$ 28.6 billion | US$ 2.8 billion | |
| 2021-22 ** | US$ 32.5 billion | US$ 72.2 billion | US$ 39.1 billion | US$ 17.5 billion | |
|
PDM |
2022-23 **** | US$ 27.9 billion | US$ 52.0 billion | US$ 24.1 billion |
US$ 2.6 billion |
*https://na.gov.pk/uploads/documents/questions/6421556b1616d_302.pdf
**https://www.finance.gov.pk/economic/economic_update_July_2022.pdf
***https://www.finance.gov.pk/Supplement_2020_21.pdf
****https://www.finance.gov.pk/economic/economic_update_May_2023.pdf
Remittances, FDI & External Debt & Liabilities:
Ruling Party |
Fiscal Year |
Remittances* |
Net Foreign Direct Investment (FDI)** |
Pakistan’s Total External Debt and Liabilities*** |
|
PPP |
2008-09 | US$ 7.8 billion | US$ 3.71 billion | US$ 52.3 billion |
| 2009-10 | US$ 8.9 billion | US$ 2.15 billion | US$ 57.4 billion | |
| 2010-11 | US$ 11.2 billion | US$ 1.63 billion | US$ 66.4 billion | |
| 2011-12 | US$ 13.1 billion | US$ 820 million | US$ 65.5 billion | |
| 2012-13 | US$ 13.9 billion | US$ 1.45 billion | US$ 60.9 billion | |
|
PML-N |
2013-14 | US$ 15.8 billion | US$ 1.69 billion | US$ 65.6 billion |
| 2014-15 | US$ 18.7 billion | US$ 1.03 billion | US$ 65.1 billion | |
| 2015-16 | US$ 19.9 billion | US$ 2.39 billion | US$ 73.9 billion | |
| 2016-17 | US$ 19.3 billion | US$ 2.40 billion | US$ 84.4 billion | |
| 2017-18 | US$ 19.9 billion | US$ 2.78 billion | US$ 95.2 billion | |
|
PTI |
2018-19 | US$ 21.7 billion | US$ 1.36 billion | US$ 106.3 billion |
| 2019-20 | US$ 23.1 billion | US$ 2.59 billion | US$ 113.0 billion | |
| 2020-21 | US$ 29.4 billion | US$ 1.82 billion | US$ 122.2 billion | |
| 2021-22 | US$ 31.3 billion | US$ 1.86 billion | US$ 130.1 billion | |
|
PDM |
2022-23 | US$ 27.0 billion | US$ 427.1 million | – |
*https://www.finance.gov.pk/supplement_2021_22.pdf
**https://www.sbp.org.pk/departments/stats/PakEconomy_Handbook/Chap-7.11.pdf
**https://www.pc.gov.pk/uploads/report/Monthly_FDI_Feb_FY21.pdf
***https://www.finance.gov.pk/supplement_2021_22.pdf
***https://www.sbp.org.pk/reports/annual/arFY11/Domestic_External_Debt.pdf
**** https://www.finance.gov.pk/survey/chapters_17/09-Public_Debt.pdf
****https://www.sbp.org.pk/reports/annual/aarFY22/Chapter-05.pdf
Also Read: Details of foreign loans taken & repaid in PTI and PML-N regimes
Foreign Exchange Reserves:
Party |
Period |
Net Reserves with State Bank of Pakistan |
Country’s Liquid Foreign Exchange Reserves |
|
PPP*
|
March 25, 2008 To March 24, 2013 |
US$ 8.57 billion (2007-08) | US$ 11.39 billion (2007-08) |
| US$ 7.12 billion (March 29, 2013) | US$ 12.20 billion (March 29, 2013) | ||
|
PML-N** |
June 5, 2013 To May 31, 2018 |
US$ 6.28 billion (June 7, 2013) |
US$ 11.44 billion (June 7, 2013) |
| US$ 9.51 billion (May 2018 end) |
USS$ 15.09 billion (May 2018 end) |
||
|
PTI*** |
August 18, 2018 To April 10, 2022 |
US$ 9.88 billion (August 2018 end) | US$ 15.39 billion (August 2018 end) |
| US$ 11.42 billion (March 2022 end) |
US$ 17.03 billion (April 08, 2022) |
||
|
PDM**** |
April 11, 2022 To Date |
US$ 11.42 billion (March 2022 end)***** | US$ 17.03 billion (April 08, 2022) |
| US$ 4.1 billion (May 26, 2023) |
US$ 9.5 billion (May 26, 2023) |
*https://www.sbp.org.pk/ecodata/FER/index.asp
**https://www.sbp.org.pk/reports/stat_reviews/bulletin/2018/Dec/ExternalSector.pdf
***https://www.sbp.org.pk/reports/annual/arFY19/Stats/Eng/Chapter-9.pdf
****https://www.sbp.org.pk/ecodata/forex.pdf
*****It’s worth noting that just a month ago (by February 2022 end) before the former Prime Minister Imran Khan was ousted through a Vote of No Confidence, the foreign exchange reserves with SBP stood at US$ 16.38 billion and the total were US$ 22.63 billion.
